
In this article, we will discuss two very important economic concepts i.e; The Laffer curve and the Phillips curve. Both of the theories plays a very important role in understanding the micro and macro economics concepts. We shall discuss in depth what the two theories explain and how important they are for policy making along with its criticism. So without further delay, let's begin !!

What is Laffer Curve ?
The concept of the Laffer curve was first introduced by a very famous economist Arthur Laffer in the year 1974. The purpose of the curve is to depict the relationship between tax rates and what the government collects as tax revenues. The takeaway from this concept is that it shows that cutting the rate of taxes can increase revenues generated for the government through tax. The Laffer curve was developed based on a bell curve analysis conducted by plotting the changes in the rate of taxes imposed by the government and its impact on the tax receipts.
Understanding the Laffer Curve
Arthur Laffer explained that the tax cuts can have two different impacts on the federal budget. The impact can be both arithmetic and economic.
- Arithmetic: The arithmetic is the instant effect that occurs after tax cuts, each dollar in the tax cuts results in one dollar short in the revenue of the government and ultimately it decreases the spending of the government by one dollar.
- Economic: On the economy tax cuts have long-term impacts and have a multiplier effect. Tax cuts tend to increase the disposable income for the taxpayers and hence they have more money to spend. People demand more goods and services when they have more money, this will increase market activity in the long term resulting in more employment and a rate of production.
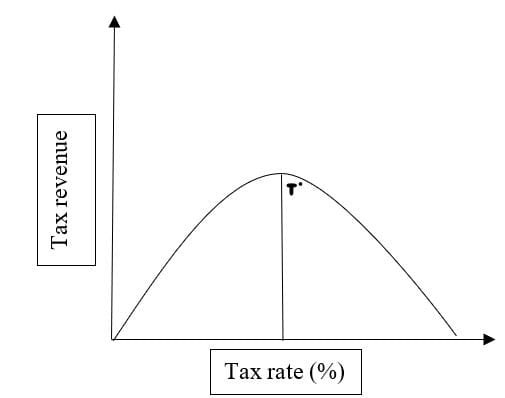
When the tax revenue reaches the highest point where it is optimum, that point is represented by T* on the graph. From the graph, it can be observed that on the left of T* an increase in the tax rate is shown to be increasing the revenue generated by tax than what has been lost by offsetting workers and the behaviour of the investors. Further increasing the rate beyond T* will cause people to leave their jobs or not work as much which will decrease the tax revenues.
If the current rate of tax is situated anywhere on the right of T* lowering the tax rates now will boost economic activity and will increase economic growth by providing people with the incentive to work more and it will also increase the revenues generated by the government through taxes.
NOTE:
Criticisms of the Laffer Curve
The theory of the Laffer curve also received a lot of criticism from experts. Some of these factors are as follows:-
- One tax rate : The system of taxes is very complicated and increasing the rate of one tax can have serious consequences on the positives or negatives of reducing another rate of tax. The Laffer curve makes the system seem very simple and it provides the illusion that the relationship between taxes by providing one simple tax rate.
- The T* tax rate changes: The Laffer curve provides an ideal tax rate somewhere between 0 and 100. However, in actual circumstances, this rate may change due to many other economic factors.
- Assumption of the concept regarding individuals and firms : The concept of the Laffer curve is based on one assumption that if the tax rates are high it will result in lower revenues because the firms may leave the market and employees will work lesser hours. Businesses and firms depend not only on the tax rates to make decisions but also depends upon their skilled workforce and infrastructure, both factors offset an increase in the tax rate.
What is Phillips Curve ?
The Phillips curve is considered to be one of the most important concepts in economics, the graph displays the relationship between inflation and unemployment. The relationship between the two economic factors is believed to be inverse and stable. The concept of the Phillips curve was first introduced by an economist named William Phillips.
He explained that when there is a boost in the economy the price rates (inflation) increase, which in return increases the jobs available, decreasing the rate of unemployment. The concept of the Phillips curve has also been proven to be false in the times of stagflation in the 1970s. During that time both the rate of inflation and the rate of unemployment were high.
Understanding the Phillips Curve
The concept of the Phillips curve explains that the impact unemployment has on inflation and vice versa is very predictable. The Phillips is a downwards-sloping, concave curve. The rate of inflation is plotted on the Y axis and the rate of unemployment is plotted on the X axis. When there is more demand in the market for goods and services, an increase in demand increases the level of prices. More production means that firms and industries hire more workers, which results in a reduction in the unemployment rate.
Phillips Curve in the Long Term
The occurrence of stagflation led scientists to study the Phillips curve closely and understand why it proved to be false under conditions. Stagflation is a situation when an economy faces stagnant growth of the economy, the rate of inflation is high and so is the rate of unemployment. Consumers and market participants predict the future rate of inflation based on the current inflation rates and unemployment.
The inverse and stable relationship between inflation and unemployment prove to be true only in the short run. When the central banks decide to increase the rate of inflation to reduce unemployment in the short run the condition may exist. But consumers build their expectations depending on the existing conditions. Hence, in the long term, the Phillips curve may shift outwards.
Criticisms of the Phillips Curve
Inflation can occur due to many different reasons; the Phillips curve does not focus on the actual reasons behind inflation and unemployment. The concept only explains how both economic factors are related. Many critics of the concept explain that the Phillips curve mainly states growth as the main cause of inflation without considering other factors. According to the concept of the Phillips curve, economic growth must increase the rate of prices. Another big criticism is that the theory behind Phillips curve does not explain the impact of money supply on the rate of inflation.
Conclusion
Both the Laffer curve and Phillips curve have a very important role in macro and microeconomics and policy making. The Laffer curve explains the relationship between the tax rates and the corresponding tax revenues. It explains that if the tax rates increase the government will receive lesser revenues from taxes. The Phillips curve on the other hand explains the relationship between inflation and the rate of unemployment. There is an inverse relationship between these two economic factors. If the rate of inflation increases, the rate of unemployment reduces respectively.